

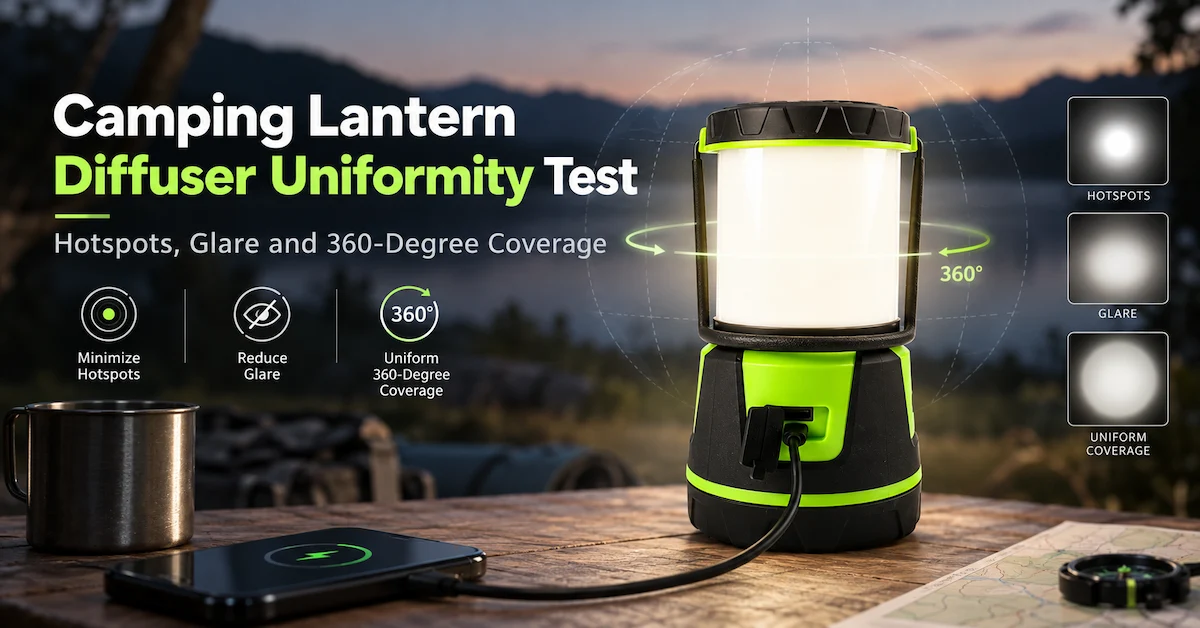
A lantern diffuser uniformity test starts with a purchasing question: can this configuration illuminate the area your customer will actually use? Mark that area, place the lantern as intended, and measure the light arriving across it. The lowest reading, the average and their relationship give you a more useful comparison than the brightest point alone.
For a shared camping table, the troublesome location may be the space beside a plate, where someone reads a food label. For a hanging tent lantern, it may be the far side of a storage pocket. Those locations belong in the evaluation even if they make a sample's average look less attractive. A diffuser that looks beautifully even in a product photograph can still leave either location in shadow.
This guide is for the buyer preparing a sample request, the supplier arranging the comparison and the quality team reviewing its files. It separates three jobs: mapping useful light on a receiving surface, checking light around the lantern, and inspecting the emitting shade. Its example grid, sample allocation and acceptance figures are proposals for an agreement. They are not a camping-lantern standard or a certificate.
Define what a lantern diffuser uniformity test will measure
Start with the surface receiving the light
Put a lux-meter head flat on a table and its reading describes incident light on that horizontal surface. Hold it vertically where a user reads an instruction sheet and you have changed the receiving geometry. Both measurements can be useful. They need different labels.
CIE S 017:2020 defines illuminance as incident luminous flux per unit area, expressed in lux. Its average-illuminance entry requires the surface and type of illuminance to be specified. In a buyer's report, that means a drawing or photograph showing the task plane, its dimensions and the lantern's position.
“Average lux at half a metre” leaves too much to interpretation. Half a metre from the hook or the shade? On a tabletop or a vertical detector facing the lamp? Along the centerline or across the usable work area? Resolve those questions in the test brief; otherwise two careful teams can produce incompatible results.
Then consider what the shade looks like
The bright surface a person sees is evaluated with luminance, in cd/m², for a stated viewing direction. CIE S 017:2020 also gives a separate luminance-uniformity definition. Measuring lux beside the shade does not measure the luminance pattern on it.
For an initial visual review, photographs can record a seam, a visible LED image or a brighter strip. Exposure and processing influence how those features appear. A saturated white patch has lost the detail you need to compare it; making that image darker afterward does not recover the clipped information. Keep these images as visual records unless a calibrated luminance workflow has been used.
Give surrounding coverage its own result
A lantern can serve a table from above or stand between people sitting around it. The second arrangement raises a directional question. A scan around the product can show which seats receive less illumination and whether a handle or control panel coincides with a low reading.
That scan is different from the table map. The former samples selected directions and detector orientations; the latter estimates illumination over a receiving area. A smooth shade, a good table map and an even surrounding scan are three separate findings. Buying decisions become clearer when each finding keeps its own measurement method.
Choose two identifiable catalog configurations
Before asking for a uniformity result, identify the product you want tested. Brightenlux's two catalog references below differ in light source and power arrangement. Their published specifications help define the sample request. Neither page supplies the raw illuminance map or calibrated shade-luminance result discussed here.
| Item | Rechargeable COB camping lantern | D-cell camping lantern |
|---|---|---|
| Published output | 2000 lm maximum | 1000 lm |
| Published light source | COB LED | 42 SMD 3014 LEDs + 4 SMD 3030 LEDs |
| Power description | 3 × 2200 mAh lithium batteries included; topology unspecified | 3 × D-size dry cells; excluded |
| Mode description | Warm, cool and natural white; red on/strobe; dimming | Warm, cool and natural white; dimming |
| Material information in page body | Diffuser material not identified | ABS + PC description; diffuser grade not identified |
| Evidence still needed | Configuration-linked map, geometry and conditions | Configuration-linked map, geometry and conditions |
The rechargeable model's advertised 2000 lm maximum does not mean that it delivers twice the lux at every table position as the advertised 1000 lm D-cell model. Position, distribution and operating condition determine that local comparison. Likewise, a battery count identifies a configuration without revealing its connection topology or proving how it will behave through an evening's use.
Ask the quotation to name the current model, selected mode options and a drawing or assembly revision. If several diffusers or batteries are available, the sample request needs to select one combination. “The camping lantern” is too loose an identity for a report that may later support order approval.
The Brightenlux About page identifies Ningbo Brightenlux Electric Appliance Co., Ltd. A supplier identity and a product specification establish who and what you are discussing. A measurement file tied to the selected configuration establishes the narrower optical evidence.
Write the application brief before choosing a pass limit
A useful brief can begin with a short description: “A standing lantern used by four people at a camping table; labels and utensils need to remain visible across the shared work area.” That is an example task description, not a tested product claim. It tells the supplier why the edge readings matter.
Draw the usable region. If the lantern stands on the table, show its footprint and decide whether the adjacent space is part of the work area. Any excluded region belongs on the drawing before testing. Deleting a dark cell after seeing the map would change the purchasing question midway through the comparison.
Choose the primary installation position as well. A hanging light can illuminate a table differently from the same light standing near its center. If both positions are promised to users, request two named setups. This is easier to review than a combined score in which a strong hanging result masks a poor standing result.
The usable-light requirement needs an absolute component. Set the minimum and average illumination needed for the task, then add a distribution limit where helpful. An evenly dim map can have a high ratio. A high average can conceal one dark work position. The report must leave both outcomes visible.
Viewing positions complete the brief. Where are the users' eyes relative to the shade? Does someone look toward it while reading or speaking to another person? For camping lantern glare, describe the feature that needs investigation: a visible emitter, a bright seam or a distracting patch from a particular seat. That gives the review a defined subject without implying that a recognized glare index has already been measured.
Connect the diffuser to the complete assembly
A shade is not tested in isolation when the buying decision concerns an assembled lantern. The emitting board, internal supports, reflector, cover position and selected mode all belong to the configuration. A change in how the cover sits can matter even when its external outline stays the same.
Give each sample a unit ID. Attach its diffuser revision, relevant dimensions and finish, LED-board revision, housing and firmware to that ID. Where a material designation is available, record it exactly. Where it is missing, leave a request for information rather than inferring a polymer grade from appearance.
The D-cell page's ABS + PC description is a whole-product material statement. It does not tell the buyer which polymer is used for the emitting cover or name a resin grade. The current rechargeable page body does not identify that cover material. These are specific gaps a supplier can resolve through its configuration documentation.
During visual inspection, identify the location of a streak, seam, contamination mark or visible gap. A close photograph and sample ID make the observation useful. They do not establish its cause. Engineering can then compare an agreed change while holding the remaining configuration constant.
Retain the baseline sample when a new diffuser is offered. Its replacement gets a new revision and a fresh assembled-product comparison. Review the absolute lux values as well as the shade's appearance: reducing a visible hotspot may also change the useful light delivered to the task. The decision belongs to the measured assembly and its intended use.
Prepare a comparison another operator can repeat
Instrument and receiving geometry
The meter record needs its model, detector, serial number, range, resolution and calibration information.
Spectral response matters for the selected LED light; cosine response matters when light arrives obliquely at the receiving face. These are instrument-performance questions, not reasons to attach a generic accuracy percentage to every reading.
NIST SP 250-95, Photometric Calibrations (2018) covers distinct photometric quantities and their measurement uncertainties. Relevant parts include section 3.4.3 on spectral mismatch and section 3.6 on illuminance-responsivity calibration.The publication's laboratory uncertainty values do not become the uncertainty of a buyer's handheld meter.
For a consequential acceptance decision, obtain the measurement provider's instrument suitability and uncertainty statement. A calibration certificate is part of that record. Alignment, positioning, source stability and the actual operating spectrum still need review. If an instrument changes during the comparison, retain the change in the record and assess whether the results remain comparable.
Room, background and power preparation
A dark room and a pale tent interior answer different questions because surrounding surfaces can contribute reflected light. Choose the environment for the comparison, photograph it and leave it intact between samples. Note the table surface, walls and nearby objects rather than describing the room only as “indoors.”
With the lantern off, measure background at the relevant points. An agreed subtraction procedure keeps raw and background values in separate fields. If daylight changes during the run, a single earlier background reading may no longer represent the conditions. When the net signal is close to background variation or meter resolution, improve the setup before reporting a precise ratio.
Prepare power according to the selected model's instructions. Identify the charge procedure or cell condition, mode and elapsed operating time. A USB connection shown in a promotional image is not enough to establish supported external-power operation. Use the allowed power arrangement and keep the temperature record with the run.
Build the task-plane lantern diffuser uniformity test
The following numbered sequence is an initial project method. A 0.60 m by 0.60 m area divided into nine equal cells offers a manageable first comparison. It is not a prescribed camping-light grid; narrower shadows or steeper gradients may require a denser final scan.
- Mark the receiving area. Put the coordinate origin at its center. For this example, cell centers lie at −0.20 m, 0 and +0.20 m along both axes. Each center represents one equal-area cell.
- Set the installation. Identify the lantern's reference point, height and orientation in a photograph. A proposed hanging comparison might place that marked reference point 0.45 m above the detector plane. Measure from the stated datum, not whichever part is easiest to reach.
- Identify the run. Enter unit ID, assembly revision, mode, power condition, start time and temperature. A standing setup needs its own usable region where the lantern and detector do not physically interfere.
- Fix the detector orientation. Keep its receiving face parallel to the horizontal task plane at every cell center. Do not tilt it toward the lantern to obtain a stronger reading. Keep hands, supports and the operator out of the light path.
- Measure the background and grid. Follow the agreed background procedure, then read all nine points in a defined sequence. Allow the meter to settle according to its instructions. Save each timestamp, raw lux value and any background adjustment.
- Check run stability. Read a reference position at the start and end. A change beyond the agreed tolerance requires investigation of time or power effects. A reverse-order repeat can help diagnose an order-dependent pattern; it remains a separate run.
- Review spatial detail. Mark visible narrow shadows and unresolved points. Additional diagnostic readings remain separately identified. If a refined grid becomes the acceptance method, apply it consistently to every compared configuration.
Nine cell-center readings estimate the area average; they do not identify every minimum between cells. Nor does an added point inside a shadow represent another equal-area cell. Preserve the grid and its represented areas so the averaging calculation follows the sampling design.
A different hanging height deserves a new map where it affects the decision. An extended lantern and its receiving geometry do not justify an assumed near-distance inverse-square correction. Measuring the requested installation is clearer than reporting a transformed map whose conditions were never observed.
Check surrounding coverage without confusing the detector geometry
For lantern light distribution around a shared seating arrangement, a proposed twelve-position scan gives the comparison a defined starting point. The positions are equally spaced on a circle at an agreed radius and height. Mark zero degrees at the control panel or another fixed feature. That mark lets the reviewer relate a low reading to the same part of each sample.
At each position, define exactly how the detector faces. A vertical detector directed toward the lantern records a different incident geometry from a horizontal detector on a surrounding work surface. Rotating the sensor to chase the largest reading at each position would defeat a controlled comparison. The geometry should represent the user's receiving surface, or be explicitly labeled as a diagnostic comparison.
Keep the twelve readings in order, together with any obstruction, support or handle position. A lower result near a structural feature may be important in normal use. Test the handle in its intended positions rather than assuming its effect is negligible. Where the lantern can hang or stand, the two arrangements may need different surrounding scans.
A scan summary can give the minimum, mean and maximum of its twelve readings. Label the minimum-to-mean indicator Rring = Emin,ring / Emean,ring. It describes these sampled directions, not CIE task-surface uniformity. Unsampled azimuths and other heights remain outside that result.
A “360-degree” buying requirement also needs a vertical scope. Broad coverage near the shade's mid-height says little about a tabletop below a base or a surface above a top cap. Request the specific positions that represent the advertised use, and avoid treating a favorable ring as proof of spherical emission.
Inspect surface hotspots and glare as a separate workstream
Take visual records from fixed, agreed viewing positions.
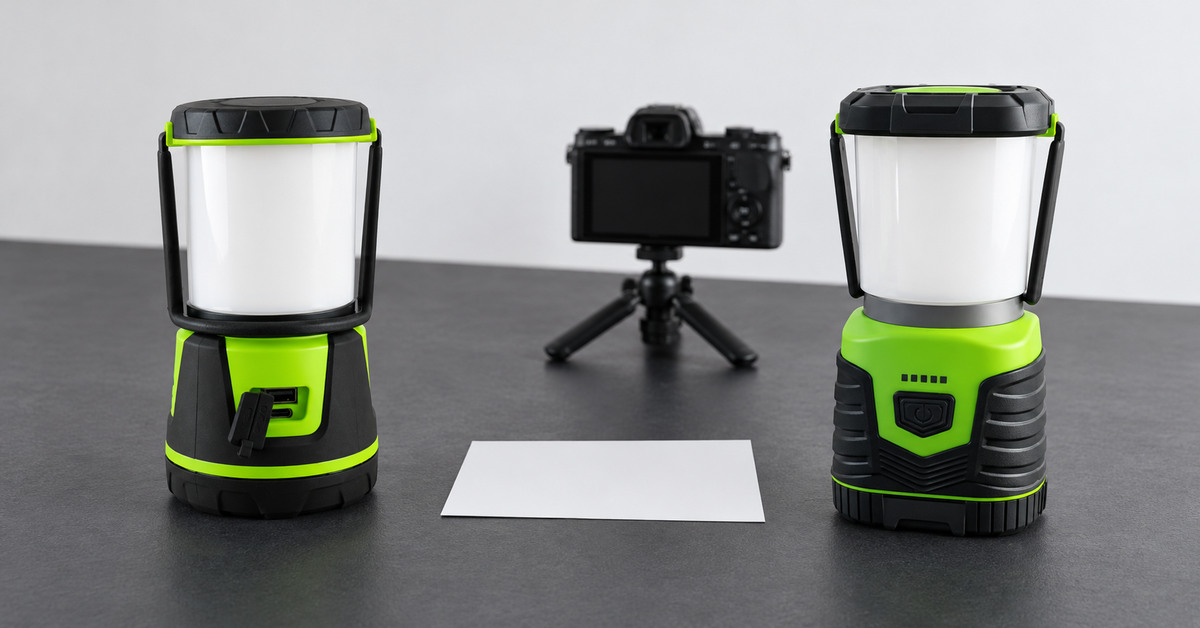
Include the view closest to the intended seated user and any position where exposed emitters or a bright seam are visible. Use consistent camera settings, background and framing for sample comparisons. Save the original files and identify saturated images that cannot show differences within their brightest regions.
Manual exposure helps preserve a consistent visual comparison. Physical luminance values require a calibrated measurement workflow. CIE 244:2021, Characterization of Imaging Luminance Measurement Devices, addresses device characterization and calibration.A quantitative shade assessment needs its viewing direction, measurement area and instrument resolution. A small hotspot must remain identifiable rather than disappearing inside a much larger averaged region.
The relevant questions are practical: can the shade be viewed in the normal seated arrangement, does a patch distract from the task, and does the handle or top leave an abrupt bright-dark pattern? These observations can inform design discussions. They should not be presented as a recognized glare index or a photobiological-safety assessment when neither has been measured.
Separate appearance from illumination. A frosted shade can hide individual LEDs while the emitted distribution remains uneven on the work surface. Conversely, a useful table map does not guarantee a comfortable view of the lamp. Retain the photographs beside the lux map so the buyer can inspect both consequences of a diffuser choice.
For a repeatable visual review, agree the viewing positions and evaluation questions before showing the samples. Ask reviewers to record the feature they object to rather than only choosing “good” or “bad.” This gives engineering something to inspect. Avoid direct staring into high-output emitters; follow the product's instructions and obtain appropriate safety evidence where required.
Calculate the sampled ratio and retain the absolute lux values
CIE illuminance uniformity is the minimum illuminance divided by the average illuminance on a surface. It is dimensionless. In a discrete comparison, the lowest measured grid value estimates the minimum and the chosen averaging method estimates the area average. Identify the sampling limitation rather than calling nine readings a complete measurement of every point.
For nine equal-area cell-center samples, use Eavg,grid = sum of the nine readings ÷ 9. Then Ugrid = Emin,sampled ÷ Eavg,grid. If the measurement points represent unequal areas, an unweighted arithmetic mean is not the same area estimate. Either revise the grid or specify defensible area weights in the protocol.
The next two sets are fictional calculation examples, not results for the linked products. Both use one fixed plane and operating condition, with any agreed background treatment already applied. Read Sample A in three rows: 42, 54, 45; 60, 82, 62; 44, 55, 46 lx. The nine values total 490 lx. Dividing by nine gives about 54.4 lx; the sampled minimum is 42 lx, so Ugrid is about 0.77.
Sample B has rows of 30, 65, 32; 70, 120, 72; 31, 66, 34 lx. These total 520 lx: a grid mean of about 57.8 lx, sampled minimum of 30 lx and Ugrid of about 0.52. Its higher average comes with a lower minimum than Sample A. That difference is the reason to retain the map instead of ranking the candidates by one summary number.
For purchasing, the average answers how much light the sampled area receives overall; the minimum identifies its weakest sampled position. The ratio describes the balance between them. All three stay with the maximum, complete grid and evaluation area. A normalized or ratio-only presentation would hide whether the absolute illumination meets the task.
Keep the comparison controls visible in the report
The following record structure helps a supplier reproduce the request and gives a buyer a way to inspect exceptions. It is a proposed checklist, not evidence that any supplier currently uses this procedure.
| Record | What to specify | Why it changes the interpretation |
|---|---|---|
| Sample identity | Model, unit ID, assembly and diffuser revisions | Links a map to the configuration being quoted |
| Application geometry | Evaluation area, coordinate origin, height and mounting position | Defines where the reported illumination is useful |
| Detector geometry | Receiving-plane orientation and sensor-head position | Prevents unlike incident-light measurements being combined |
| Instrument | Meter identity, range, resolution, calibration and relevant corrections | Supports review of measurement suitability and uncertainty |
| Power and mode | Battery type or supply condition, state, selected mode and elapsed time | Distinguishes optical distribution from operating-condition changes |
| Environment | Ambient readings, temperature, surrounding surfaces and photographs | Records background and reflected-light contributions |
| Grid method | Point coordinates, represented areas, sequence and raw readings | Makes the average and sampled minimum auditable |
| Separate observations | Surrounding scan, surface photographs and any luminance measurements | Keeps coverage and appearance claims tied to their own methods |
| Exceptions and decision | Missing points, repeat reasons, uncertainty and agreed release rule | Shows why a sample passed, failed or remains unresolved |
Every saved image and data file should carry the sample ID, setup and time. If the lamp was moved between a photograph and its map, state that explicitly. An attractive composite made from several arrangements may be useful marketing artwork, but it cannot identify the geometry behind an individual measured result.
Copy a nine-point run record into the sample request
This blank record uses the example cell-center coordinates. Replace its geometry when the agreed area changes. A point's timestamp or elapsed time accompanies its mode and readings; the net field is used only where the agreed method includes background subtraction.
Unit ID: ____  Configuration revision: ____  Run: ____
Meter/detector: ____  Setup reference: ____  Power preparation: ____
Height/datum: ____  Temperature: ____  Background method: ____
P1 (-0.20,-0.20 m): mode ____; time ____; raw ____ lx; background ____ lx; net ____ lx
P2 (0,-0.20 m): mode ____; time ____; raw ____ lx; background ____ lx; net ____ lx
P3 (+0.20,-0.20 m): mode ____; time ____; raw ____ lx; background ____ lx; net ____ lx
P4 (-0.20,0 m): mode ____; time ____; raw ____ lx; background ____ lx; net ____ lx
P5 (0,0 m): mode ____; time ____; raw ____ lx; background ____ lx; net ____ lx
P6 (+0.20,0 m): mode ____; time ____; raw ____ lx; background ____ lx; net ____ lx
P7 (-0.20,+0.20 m): mode ____; time ____; raw ____ lx; background ____ lx; net ____ lx
P8 (0,+0.20 m): mode ____; time ____; raw ____ lx; background ____ lx; net ____ lx
P9 (+0.20,+0.20 m): mode ____; time ____; raw ____ lx; background ____ lx; net ____ lx
Reference start/end: ____  Missing points/reason: ____
Map/photo filenames: ____  Decision rule: ____  Review outcome: ____
Leave an unavailable reading blank with its reason. Replacing it with a neighboring value would create evidence the run did not produce. With all nine equal-area samples valid, their arithmetic mean gives the grid estimate; an incomplete map needs review before that calculation is used for acceptance.
Separate power behavior from diffuser behavior
The run label needs more than “fully charged.” For a rechargeable sample, include its agreed charge procedure, initial state and elapsed operating time. For a replaceable-cell sample, include cell type, brand or controlled source, condition and installation. Those fields allow the next operator to prepare the same comparison. External power belongs in the method only when the model supports it.
Two settings named “high” can deliver different illumination. One session can compare each product in its nominated mode under the stated starting condition. Another can compare an agreed useful-light level, where the available controls allow it. Label the sessions separately: the first compares the offered modes, the second investigates distribution at a selected level. Both retain their absolute lux readings.
Normalizing a map by its average can help discuss distribution shape, but the normalized map cannot demonstrate absolute usable illumination. Do not discard the original measurements. If one product cannot provide the desired operating level, its normalized pattern does not solve that limitation.
For a sustained-use requirement, repeat the relevant map at agreed elapsed times. This checks the chosen operating conditions across the period the buyer cares about. It does not establish total runtime unless the report also defines the runtime endpoint and follows an appropriate method. Note charging, mode changes or battery replacement between sessions.
A substantial change in a reference reading during a grid scan can bias the apparent spatial pattern. Shorten the scan, improve power control within the allowed interface or use a justified measurement arrangement. Correcting every reading by an assumed drift curve without evidence can create a neat map of a condition that was never actually observed.
Use repeats to understand sample and setup variation
A sample with a visible dark band gives engineering something specific to investigate. Whether that band appears across an order is a different question. The comparison brief therefore identifies the units selected, their configuration and the assembly variations it is intended to examine. A convenient development group is not automatically a representative production sample.
For an initial screen, the project might choose five units per configuration and repeat one map after removing and reinstalling each unit. This is a proposed allocation for detecting obvious unit and positioning differences, not a confidence statement or a universal sampling plan. Keep each unit's result, including the less favorable maps, rather than averaging them into a single anonymous picture.
Reading the same fixed setup again explores short-term variation. Removing and reinstalling the lantern adds positioning and installation effects. Asking another operator to reconstruct the setup also tests the clarity of the instructions. Label these repeats by what changed; calling all of them “repeatability” would obscure useful information.
For uncertainty, ask the laboratory which contributions apply to the reported result: instrument response, resolution, background treatment, alignment, positioning, operating stability and the chosen sampling approximation. A uniformity ratio can share errors between its numerator and denominator. Do not assume either complete cancellation or complete independence without reviewing the measurement model.
When two candidates are close, the right outcome may be further measurement rather than a declared winner. A visible difference in rounded ratios can be smaller than the practical uncertainty of the arrangement. Retain sufficient digits in the raw data, report justified precision and make the release rule explain what happens near a limit.
Agree acceptance limits without inventing an industry pass mark
The acceptance agreement should name the application, configurations, setups, required exposure and permitted exclusions. It should specify both absolute useful-light requirements and any sampled distribution limit. A statement such as “good uniformity” leaves the supplier and buyer free to judge different areas and modes.
For the fictional nine-point example, a project could propose a grid mean of at least 50 lx, a sampled minimum of at least 40 lx and Ugrid of at least 0.70 under that defined arrangement. Those values are solely a worked purchasing proposal. They are not a CIE camping-lantern recommendation, a market requirement or a Brightenlux published specification.
Using the nominal example values, Sample A meets those three proposed numbers; Sample B meets the mean but falls short on minimum and ratio. A final decision would still follow the agreement's uncertainty rule. For instance, a measured minimum of 42 lx with a relevant uncertainty interval extending down to 39 lx cannot simply be described as comfortably above a 40 lx limit.
Decide before testing whether borderline results are held for review, remeasured or evaluated with an agreed guard band. State how invalid points and interrupted runs are handled. Repeating only a failed corner until it reads higher is not the same as rerunning the defined map under a documented correction.
Uniformity and appearance requirements should remain separate acceptance lines. A successful table map does not establish a glare or safety result. If those claims are contractual, obtain the appropriate assessment for the actual model and use conditions. Packaging, electrical safety and transport requirements also retain their own evidence; an optical comparison cannot substitute for them.
After a diffuser, LED board, support or firmware change, identify which tests the change can affect. Repeat the affected arrangements and relevant regression checks on the revised configuration. Keep the earlier records so the buyer can understand the reason for the change and the evidence supporting its approval.
Send the application, proposed model and test geometry to discuss a configuration-specific sample comparison.
Request a Lantern Sample ComparisonConnect optical changes to the quotation and production specification
A diffuser improvement can affect more than the map. Confirm whether it changes the part revision, fit, appearance, assembly, packaging or permitted operating conditions. Ask the supplier to distinguish a readily available configuration from a development change requiring new approval. This gives purchasing a basis for comparing scope rather than assuming every optical option is interchangeable.
Purchasing needs a quotation for this configuration, quantity, customization and packaging. MOQ, development cost and lead time belong in that quotation, alongside the delivery terms. A public catalog page identifies the product; it does not establish the commercial terms of a different buyer's project.
For OEM or ODM work, write down who owns the acceptance drawing, which optical components may be substituted and what triggers a new sample review. A logo change may be commercially straightforward, while a cover, LED or power change can affect the lighting evidence. The supplier should identify the actual change, and both parties should agree how its consequences will be checked.
Retain a clearly identified approved sample where practical, alongside drawings, photographs and data. The sample supports comparison but does not replace an inspection procedure. For order release, specify how production inspection relates to the approved configuration, how nonconformities are reported and when broader investigation is needed.
If packaging or shipment can move a relevant component, a before-and-after optical comparison may be part of an agreed development check. The condition, sequence and resulting assembly state must be described. This remains a project investigation unless a separate, applicable transport qualification is commissioned; it does not turn an informal shipment into certification.

Ask for a report that answers the purchasing question
A lantern diffuser uniformity test report should let another reviewer reconstruct the measured arrangement. Ask for the model and unit IDs, configuration revisions, method version, geometry, instrument details, environment, power condition, raw readings and calculation rules. Include photographs that show the setup as well as the visible shade.
The data should preserve each unit and condition. A single “average uniformity” number across several modes or mounting heights can conceal the arrangement that matters to the buyer. Request the individual maps first and a summary that identifies the evaluated conditions, unresolved exceptions and release decision.
The supplier can also state what the report does not cover. A useful task-plane comparison may contain no calibrated luminance assessment, runtime result or transport qualification. Naming those boundaries makes the evidence easier to use and prevents procurement from attaching an unsupported claim to its packaging brief.
For an inquiry, provide the application, intended model, diffuser and other configuration choices, power arrangement, quantity, destination market, packaging and timeline. Attach the proposed evaluation area and mounting position. Ask for current instructions, available configuration information and the feasibility of a sample report under those conditions.
The Brightenlux contact page provides the route for that request. Its published email is admin@brightenlux.com and telephone is 0086-574-65130100. Confirm the final test scope and commercial terms directly for the chosen configuration. This article's method is a starting document for the discussion, not a promise that every instrument, customization or report is included with a standard order.
FAQ
What does a lantern diffuser uniformity test prove?
It describes the measured configuration under stated conditions. A task-plane map can estimate how evenly useful illuminance is distributed over its evaluation area. It does not automatically prove comfortable viewing, complete surrounding coverage, production consistency or safety.
Can I use one center lux reading to compare diffusers?
A center reading describes that location. It cannot reveal a dark edge or a shadow elsewhere. Keep it as one point in a defined map, and compare the sampled minimum and area estimate alongside the full set of readings.
Is a higher uniformity ratio always better?
Only in relation to the agreed task. An almost dark map can be very uniform. Pair the ratio with minimum and average illuminance requirements, then check whether the mounting position and mode represent the promised use.
Does a smooth diffuser photograph establish low glare?
No. Camera processing can conceal bright patches, and a photograph alone is not a calibrated luminance or recognized glare assessment. Use fixed viewing records for discussion and obtain the appropriate quantitative assessment when the claim requires it.
Can I compare a ring scan with a tabletop grid?
They answer different questions. A ring scan samples defined surrounding directions and detector orientations; a tabletop grid estimates illuminance over a receiving area. Keep their methods and ratios separately labeled rather than placing them in one ranking.
Do I need the same battery condition for both samples?
You need an agreed, documented operating condition for each comparison. If battery types differ, specify how each is prepared and when measurements begin. Record mode and elapsed time so a power-related change is not attributed solely to the diffuser.
Is nine points enough for every lantern?
Nine equal-area cell-center readings are an initial screen in this proposed method. Narrow shadows or steep gradients can require finer sampling. Fix the final grid consistently for the compared configurations and retain the coarse map as a separate record.
What if background subtraction gives a near-zero value?
Preserve the raw and background readings and investigate resolution, background variation and measurement uncertainty. Do not hide the problem by replacing the point with zero or a neighboring reading. Improve the conditions before making a precise ratio claim.
Can a diffuser material specification replace sample testing?
It helps control the part, but the assembled lantern also includes emitters, internal structures, fit and operating conditions. Confirm the actual configuration and compare its measurements. Material names alone do not establish task-plane performance.
What should I submit when requesting sample evidence?
Send the application, model, configuration, power arrangement, diffuser requirements, quantity, market, packaging and timeline. Add the proposed area, mounting position, mode and decision rule. Ask which evidence can be supplied and which work needs a separate quotation.
Make the measured configuration the one being ordered
A useful lantern diffuser uniformity test links the purchasing task to an identifiable sample and a reproducible measurement arrangement. Its report keeps the absolute lux values, sampled distribution and visual observations distinguishable. That makes a dark corner or uncomfortable view discussable without stretching a catalog claim.
Carry the approved configuration and acceptance procedure into the quotation and production specification. When a component or operating option changes, review the relevant evidence again. The goal is a clear decision about the lantern being ordered, supported by measurements that another person can inspect and repeat.
Share your application and configuration brief to request the next sample-evidence step.
Discuss Your Lantern QA Requirements